
- Catalogs
- Fincantieri - Cantieri Navali Italiani
- 2018 FULL YEAR RESULTS


2018 FULL YEAR RESULTS

2018 FULL YEAR RESULTS
- Order Intake: €8.6 billion with 27 new vessels ordered, including 14 cruise ships.
- Total Backlog: Reached a record-high of €33.8 billion, a 29% increase from FY 2017.
- Revenues: Increased by 9% to €5.5 billion.
- EBITDA: €414 million, a 21% increase from FY 2017, with a margin of 7.6%.
- Net Debt: €494 million.
- Proposed Dividend: €0.01 per share.
- VARD Integration: Completion of VARD's delisting and integration with Italian operations for enhanced coordination.
- Joint Venture: Formation of a 50/50 joint venture with Naval Group, backed by French and Italian governments.
- Acquisition: Agreement to acquire 50% of Chantiers de l’Atlantique, pending antitrust approval.
- Sustainability Plan: Introduction of the first sustainability plan to align business growth with social and environmental sustainability.
- Infrastructure Projects: Participation in major projects like the longest suspension bridge in Romania.
- Deliveries: 35 vessels delivered, including 7 cruise ships and 6 naval vessels.
- New Orders: Significant orders from clients such as Viking Cruises, Silversea Cruises, and the US Navy.
- Shipbuilding: Strong performance with increased revenues and backlog.
- Offshore & Specialized Vessels: Stable revenues, but margins impacted by low profitability in certain projects.
- Equipment, Systems & Services: Revenue growth of 16.7%.
- Revenues: €4,678 million, a 9.6% increase from FY 2017, driven by progress in cruise ship construction and naval projects.
- EBITDA: €395 million with an 8.5% margin, supported by cruise ship deliveries and naval contracts.
- Capex: €124 million.
- Orders: €7,129 million, including 14 cruise ships and 1 Littoral Combat Ship.
- Backlog: €23,714 million.
- Deliveries: 7 cruise ships, 1 oceanographic vessel, and 5 naval vessels.
- Net Working Capital: Improved from -€120 million to €44 million.
- Net Financial Position: Increased net debt from €314 million to €494 million, reflecting higher production volumes and working capital needs.
- Expected results in line with 2018, with revenue and EBITDA growth.
- Net debt anticipated to rise due to working capital financing needs.
- Delivery of 11 units, including 8 cruise ships and 3 naval units.
- Continued execution of VARD’s backlog and production adjustments.
- Growth in Equipment, Systems & Services due to naval contracts and cruise ship production.
- Revenues: €681 million, stable compared to FY 2017.
- EBITDA: -€20 million, with a -2.9% margin due to low profitability in offshore projects.
- Orders: €913 million, including vessels for the Norwegian Coast Guard and electric ferries.
- Backlog: €987 million.
- Deliveries: 22 ships, including module carrier vessels and fishing units.
- Revenues: €651 million, a 16.7% increase from FY 2017.
- EBITDA: €73 million with an 11.2% margin.
- Orders: €1,006 million, including cruise ship modernization projects.
- Backlog: €1,638 million.
- Revenues: Increased from €5,020 million in FY 2017 to €5,474 million in FY 2018.
- EBITDA: Improved from €341 million to €414 million.
- Net Result: Increased from €53 million to €69 million.
- Cash Flow: Ending cash balance rose from €274 million to €677 million.
- Net Fixed Assets: Slight decrease from €1,743 million to €1,703 million.
- Net Working Capital: Improved from -€120 million to €44 million.
- Net Debt: Increased from €314 million to €494 million.
Catalog excerpts

2018 FULL YEAR RESULTS February 26, 2019
Open the catalog to page 1
Safe Harbor Statement This Presentation contains certain forward-looking statements. Forward-looking statements concern future circumstances and results and other statements that are not historical facts, sometimes identified by the words "believes," "expects," "predicts," "intends," "projects," "plans," "estimates," "aims," "foresees," "anticipates," "targets," and similar expressions. The forward-looking statements contained in this Presentation, including assumptions, opinions and views of the Company or cited from third party sources, are solely opinions and forecasts reflecting current views...
Open the catalog to page 2
FY 2018 Key Messages Solid financial and operating performance • Robust order intake at €8.6 bln with orders for 27 new vessels − Order intake 14 new cruise ships for 8 different shipowners Acquisition of a new important client: TUI Cruises (RCL Group) • Record-high Total backlog(1) with 116 units at €33.8 bln (+29% vs FY 2017) − • Revenues increased by 9% to a record-high level of almost €5.5 bln (+9% vs FY 2017) • EBITDA at €414 mln (+21% vs FY 2017) and EBITDA margin at 7.6% (6.8% in FY 2017) • Adjusted Net Income at €108 mln (+19% vs FY 2017) • Net debt at €494 mln • Proposed dividend €1...
Open the catalog to page 3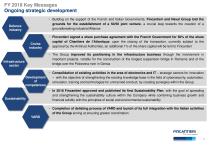
FY 2018 Key Messages Ongoing strategic development • Building on the support of the French and Italian Governments, Fincantieri and Naval Group laid the grounds for the establishment of a 50/50 joint venture, a crucial step towards the creation of a groundbreaking industrial Alliance Defence industry Cruise industry • Fincantieri signed a share purchase agreement with the French Government for 50% of the share capital of Chantiers de l’Atlantique; upon the closing of the transaction, currently subject to the approval by the Antitrust Authorities, an additional 1% of the share capital will be...
Open the catalog to page 4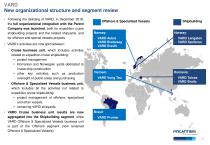
VARD New organizational structure and segment review • Following the delisting of VARD, in December 2018, the full organizational integration with the Parent Company was launched, both for expedition cruise shipbuilding projects and the related shipyards, and for offshore and special vessels projects • VARD’s activities are now split between: − Cruise business unit, which includes activities related to expedition cruise shipbuilding: project management Romanian and Norwegian yards dedicated to cruise ship construction other key activities such as production oversight of public areas and...
Open the catalog to page 5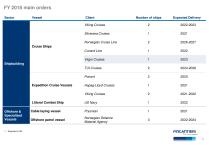
Sector Vessel Shipbuilding Offshore & Specialized Vessels Cruise Ships Client Viking Cruises Silversea Cruises Norwegian Cruise Line Cunard Line Virgin Cruises Expedition Cruise Vessels Littoral Combat Ship Cable laying vessel Offshore patrol vessel TUI Cruises Ponant Hapag-Lloyd Cruises Viking Cruises US Navy Prysmian Norwegian Defence Material Agency
Open the catalog to page 6
Cruise ship “Carnival Horizon” Oceanographic vessel “Kronprins Haakon” Cruise ship “Seabourn Ovation” Carnival Cruise Line (Carnival Corporation) Institute of Marine Research Seabourn Cruise Line Monfalcone Riva Trigoso - Muggiano/ Vard Langsten Sestri Ponente Cruise ship “MSC Seaview” Cruise ship “Viking Orion” Viking Ocean Cruises Ancona Cruise ship “Nieuw Statendam” Holland America Line Marghera Expedition cruise vessel “Le Laperouse” Ponant Expedition cruise vessel “Le Champlain” Ponant Offshore & Specialized Vessels FREMM “Martinengo” Littoral Combat Ships “Sioux City”...
Open the catalog to page 7
Carnival Horizon Seabourn Ovation Kronprins Haakon FREMM Martinengo Module Carrier Vessel (x12) LPG Carrier Jorge Amado Viking Orion Offshore & Specialized Vessels
Open the catalog to page 8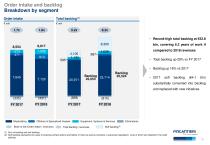
Order intake and backlog Breakdown by segment Order intake 6.2x • Record-high total backlog at €33.8 bln, covering 6.2 years of work if compared to 2018 revenues • Total backlog up 29% vs FY 2017 • Backlog up 16% vs 2017 substantially converted into backlog and replaced with new initiatives Offshore & Specialized Vessels Book-to-bill (Order intake / revenues) Equipment, Systems & Services Total backlog / revenues (1) Sum of backlog and soft backlog (2) Soft backlog represents the value of existing contract options and letters of intent as well as contracts in advanced negotiation, none of which...
Open the catalog to page 9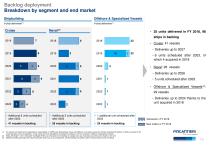
Backlog deployment Breakdown by segment and end market Shipbuilding # ship Offshore & Specialized Vessels • 35 units delivered in FY 2018, 98 ships in backlog • Cruise: 41 vessels − Deliveries up to 2027 − 6 units scheduled after 2023, of which 4 acquired in 2018 • Naval: 28 vessels − Deliveries up to 2026 − 5 units scheduled after 2023 • Offshore & Specialized Vessels(3): 29 vessels − Deliveries up to 2024 thanks to the unit acquired in 2018 • Additional 6 units scheduled after 2023 • 1 additional unit scheduled after 2023 • Additional 5 units scheduled after 2023 For reasons connected to the...
Open the catalog to page 10
Revenues Revenues breakdown by segment(1) € mln − Offshore & Specialized Vessels revenues in line with FY 2017 FY 2017 - Reported Shipbuilding Cruise Other Shipbuilding − Equipment, Systems & Services revenues up 16.7% vs FY 2017 Offshore & Specialized Vessels Naval Equipment, Systems & Services (1) Breakdown calculated on total revenues before elimina
Open the catalog to page 11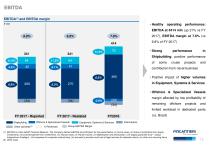
FY 2017 - Reported FY 2017 - Restated FY2018 Shipbuilding Offshore & Specialized Vessels Equipment, Systems & Services Eliminations Other activities2C O % Revenues Group EBITDA Margin • Healthy operating performance: EBITDA at €414 mln (up 21% vs FY 2017), EBITDA margin at 7.6% (vs 6.8% of FY 2017) • Strong performance in Shipbuilding: positive performance of some cruise projects and contribution from naval business • Positive impact of higher volumes in Equipment, Systems & Services • Offshore & Specialized Vessels margin affected by low profitability of remaining offshore projects...
Open the catalog to page 12All Fincantieri - Cantieri Navali Italiani catalogs and brochures
 MEIN SCHIFF RELAX
2 Pages
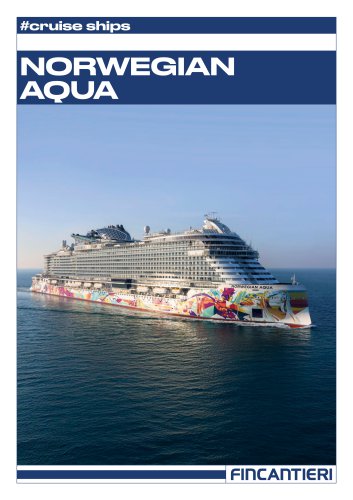 NORWEGIAN AQUA
3 Pages
Archived catalogs
 COSTA FIRENZE
2 Pages
 SILVER MOON
2 Pages
 ENCHANTED PRINCESS
2 Pages
 Submarine U212A Todaro Class
2 Pages
 SEVEN SEAS SPLENDOR
2 Pages
 NIEUW AMSTERDAM
2 Pages
 CARNIVAL PANORAMA
2 Pages
 CARNIVAL HORIZON
2 Pages
 VIKING JUPITER
2 Pages
 KONINGSDAM
2 Pages
 SKY PRINCESS
2 Pages
 CARIBBEAN PRINCESS
2 Pages
 RUBY PRINCESS
2 Pages
 REGAL PRINCESS
2 Pages
 MAJESTIC PRINCESS
2 Pages
 passenger ferry
2 Pages
 F.-A.-Gauthier
2 Pages
 Inshore Patrol Vessels
2 Pages
 Offshore Patrol Vessels
2 Pages
 FINCANTIERI
50 Pages
 ANNUAL REPORT 2016
140 Pages
 Business Plan 2016-2020
15 Pages
 Transverse Tunnel
6 Pages
 M 10-16
2 Pages
 PRESENTATIONS 1.4
23 Pages
 PRESENTATIONS
14 Pages
 Company Profile
74 Pages
